Weather and climate data basics#
Before we get into how to choose, download, and work with specific weather and climate data, in this section, we will introduce a commonly-used data format for weather and climate data, and cover basic data loading and plotting skills.
The NetCDF data format#
We start this section with a guide to the NetCDF format, a common data format used for weather and climate data. Most weather and climate datasets will be published primarily or additionally in the NetCDF format. It’s efficient, self-describing, and supported in major programming languages (though some software packages commonly used in economics, such as STATA, may require pre-processing the data into another format - .csv, etc.). If you get familiar with the commands to read the header and access data in the language you’re most comfortable with, you will be able to work with most existing climate or weather datasets.
We’ll walk you through downloading specific weather data in the next section, but to follow along with the interactive portions of this section, feel free to download sample NetCDF files, such as any on this page.
Your code environment#
Throughout this section, we introduce relevant commands whenever possible for the following languages and packages (click on the tab names for details):
xarray (recommended) is a package for working with N-dimensional data that natively supports NetCDF files.
For any Python (xarray) code chunks, it’s assumed that the xarray package is loaded as xr:
import xarray as xr
MATLAB has native support for working with N-dimensional data.
Support through the ncdf4 package.
For any R code chunks, it’s assumed the ncdf4 package is loaded with:
library(ncdf4)
Support through the netCDF4 module.
For any Python (NetCDF4) code chunks, it’s assumed that the NetCDF4 package is loaded as nc:
import netCDF4 as nc
nco (“NetCDF operators”) - a series of command-line tools to check the contents of a file, collate different NetCDF files, and extract individual variables without having to go through a full language. Here are a few important commands:
ncview(to display spatial data),ncks(“nc kitchen sink” - to split or concatenate files command line), andncdump(to print contents of the file) - you will likely primarily needncdump -h, which prints the file header
Tip
If you know several of the languages referred to in this tutorial and just want our opinion on which one to use, we suggest:
Python (
xarray): if you want open-source tools specifically designed for modern uses of weather/climate data that do much of the annoying background work (dealing with different file structures, variable names, date formats, etc.) for you, at the expense of less flexibility for uncommon needs. Much of modern climate science is conducted usingxarray.MATLAB: if you like a simple, bare-bones treatment of data where you are in explicit control of everything that happens, at the expense of having to be more careful with pre-processing and backend management.
NetCDF contents#
The core function of NetCDF files is to store arrays. These arrays may have one dimension (e.g., time), two dimensions (e.g., latitude and longitude), three dimensions (e.g., latitude, longitude, and time), or more. The other contents of the file help you to interpret these arrays.
NetCDF files have three kinds of information:
Attribute: Documentation information associated with either individual variables or the file as a whole (“global attributes”). Each attribute has a name (e.g.,
version) and text content (e.g., “Someone to Lean On”).Variables: The arrays themselves, containing the data you want. Each array has an order of dimensions. For a two-dimensional array, the first dimension corresponds to the rows and the second dimension to the columns.
Dimensions: The dimensions information in a NetCDF shows how many elements are spanned by each dimension. For example, a file containing a 1-degree grid over the world may have a
londimension of length 360 and alatdimension with length 180.
Typically, dimensions will have their own variables (generally with the same name). These variables give you the value of each index in the dimension. For example, if there is a lon dimension with length 360, there will usually be a lon variable, which is a 1-dimensional array. Its contents would look something like [-179.5, -178.5, -177.5, ..., 179.5].
NetCDF file organization#
The NetCDF file structure is self-describing, meaning all the information you need to understand the data is contained within the file as well (in theory). However, the format doesn’t require any specific information to be included apart from variables and dimensions (see, e.g., the data structure model of the file format here). The names of attributes, which attributes are included, etc., may vary between files.
There are, unfortunately, few general filesystem standards used when publishing historical weather observations. Though this guide generally focuses on choosing weather products, we will briefly introduce a situation in which filesystem standards are more generally used, namely in climate model ouptut. These data will often be standardized to the format used by CMIP (the “Coupled Model Intercomparison Project,” a ‘model intercomparison project’ in which different modeling groups agree to run their climate models on identical climate ‘experiments’ and publish their data in a uniform format). CMIP6 is the latest generation of the largest ‘MIP’, analysis of which makes up a substantial portion of IPCC reports. As we will cover later, we recommend preprocessing weather data to follow these file characteristics as well, which will make it easier to apply code across data products.
Note
Depending on its age, climate data you will encounter will generally follow a CMIP6 filename format, of the form:
[variable shorthand]_[frequency]_[model name]_[experiment]_[run]_[grid label]_[timeframe].nc
or a CMIP5 filename format, of the form:
[variable shorthand]_[frequency]_[model name]_[experiment]_[run]_[timeframe].nc
The following terminology will be useful to recognize even when filenames are not of the CMIP format, as it is frequently used in weather data products.
some commonly encountered variable shorthands:
tas= temperature; “[air] temperature at surface,” which is different from “surface temperature” (the temperature of the ground) or temperature at other heights. Sometimes also listed ast2mfor 2m air temperature orTREFHTfor reference height temperature. (Always assumed to be taken a few feet off the ground to avoid confusing air temperature with the surface radiating temperature)pr= precipitation rate
frequency: e.g., day for daily
experiment: some descriptor of the forcing (e.g., profile of greenhouse gases), e.g., rcp85 for the RCP8.5 scenario frequently used in projections.
run: if the same model was run multiple times with the same forcing, but different physics or initial conditions (to sample internal variability, for example), it will be noted here (e.g., r1i1p1). In weather data products, this could refer to different draws from an uncertainty ensemble (testing robustness against different weather station subsets or methodologies, for example).
grid label: name of the model grid
timeframe: frequently in
yyyymmdd-yyyymmddformat.
See also
For more information on “CMIP5” and “CMIP6” terminology, see: CMIP6 Guidance for Data Users or the CMIP5 Standard Output.
Caution
Weather and climate variables in NetCDF files may be organized in a few different ways:
one variable per file: each file contains a single variable over a time domain
one timestep per file: each file contains a single timestep with a suite of variables
combination: file contains many variables over a time domain (rare due to size constraints)
To figure out which file saving convention your NetCDF file uses and what is contained, you’ll need to check the header of the file.
The NetCDF header#
NetCDF files are self-describing, meaning that the file itself contains descriptive information about the data contained within. Every NetCDF file has a header that describes these contents. This will often be the first aspect of the file you look at, to verify the file has the variables you need, in what order the dimensions of the variables are stored, what the variables are named, etc. Here are the commands to print the header for NetCDF filename fn:
ds = xr.open_dataset(fn)
ds

# To show attributes of specific variables (for example,
# of a variable called "variable")
ds.variable
ncdisp(fn)
ncfile <- nc_open(fn)
ncfile
ds = nc.Dataset(fn)
ds
ncdump -h fn
You can find what a sample NetCDF header looks like here; the example shown at the link is roughly what the output of the nco, R, and Matlab code will look like. In xarray, the header is formatted for easier reading:
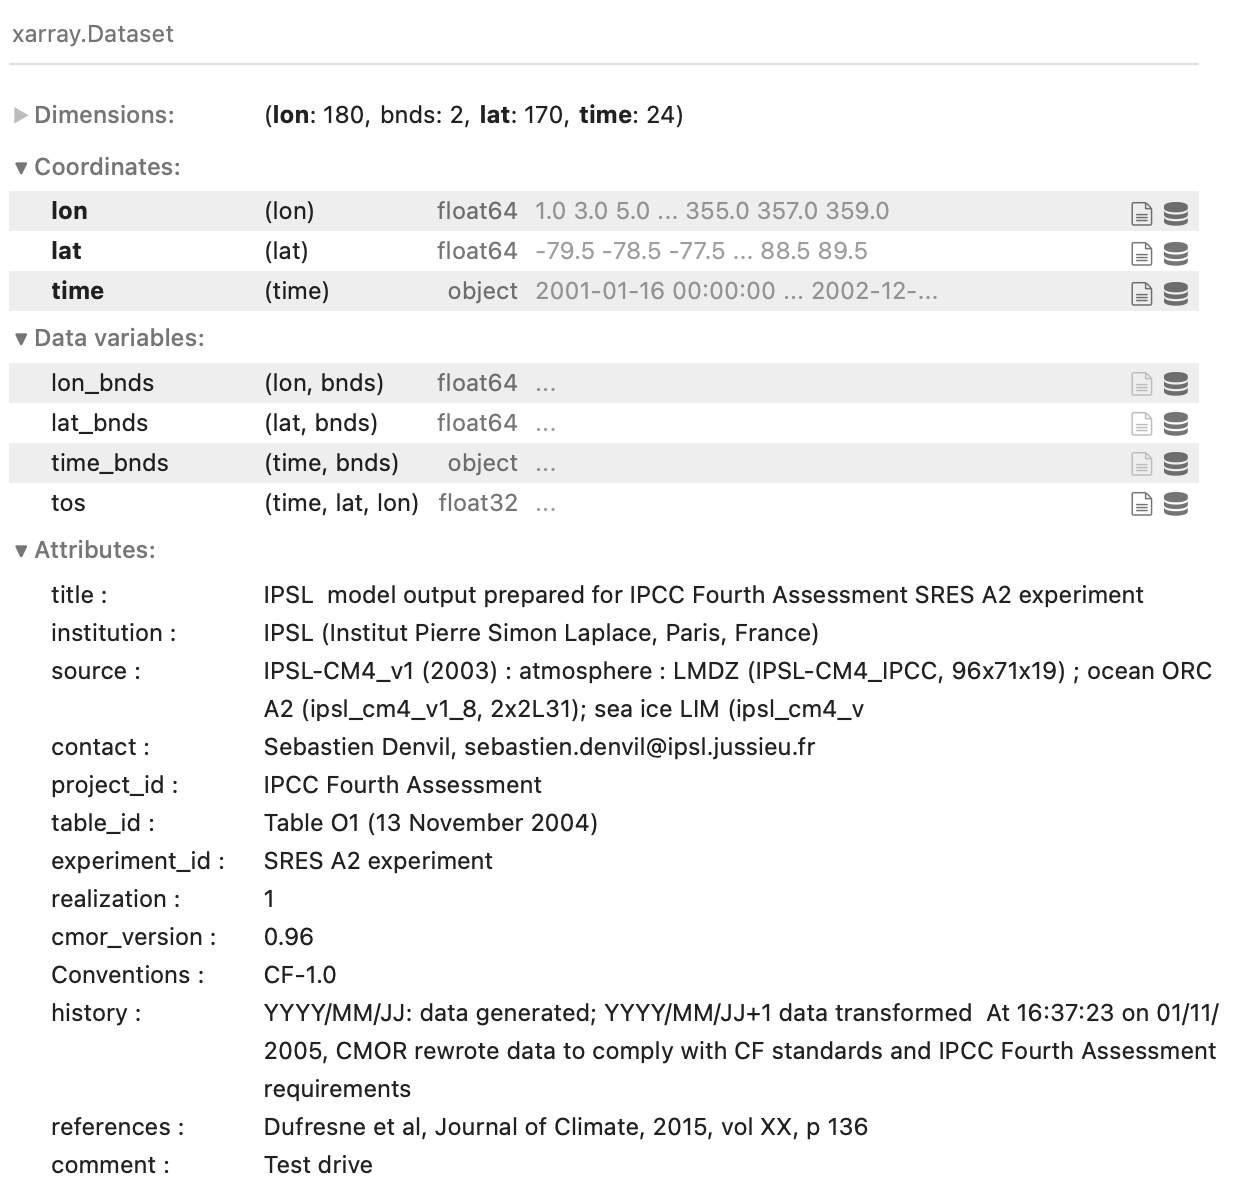
Fig. 2 The header of a sample NetCDF file, displayed using xarray in Python.#
The header will contain any ‘global attributes,’ which are just text fields that typically contain housekeeping information (information specifying the institution that created the file, copyright information, etc.). Then, for each variable contained within the file, the header specifies the names and sizes of their dimensions, plus any variable-specific attributes, like units.
Use the header to check what your desired variable is called, and what dimensions it has. The header can also be used to verify the order of dimensions that a variable is saved in (which you will have to know to use, unless you’re using a tool like xarray that lets you refer to dimensions by name) - for a 3-dimensional variable, lon,lat,time is common, but some files will have the time variable first.
Attributes#
Here are some important common “attributes” of NetCDF files or variables:
Units - generally attached to the variable in question. Common variable units:
Temperature - almost always in Kelvin, but sometimes in \(^\circ C\) or \(F\).
Precipitation - often in kg/m^2s, which is the SI unit for precipitation rate (volume per time). Multiply by 3600 to get mm/hour, or 141.7323 to get in/hour (the density of water is 1000 kg/m^3, multiplying by this density calculates the rate in m/s, or depth/time - the rest is just accounting to your desired units of depth and time).
Missing / Fill Value - if there are some absurdly high or low values in your data, you may want to check if those just represent the missing / fill value, a common sub-attribute of variables. Data may also be stored in “masked arrays”.
Calendar - probably the most important and inconsistent attribute for climate data, though for for historical ‘weather’ data products, one would hope it just follows the Gregorian calendar. Either global, or attached to the “record-keeping dimension” (
time). Common formats include365_day / noleap / 365day / no_leap / etc. - the years are magically shortened so they all have 365 days (most common for climate data)
gregorian / proleptic_gregorian - modern calendar with leap years
360_day - rare calendar in which the year has 360 days (so all months have equal lengths). To my knowledge, the Hadley Model is the only major recent model to use this, but be aware of its existence.
Reading NetCDF data#
NetCDF files can be easily imported as numeric data in any language. Here are some common ways, for the variable variable:
ds = xr.open_dataset(fn)
ds.variable
xr.open_dataset(fn) prepares to load all variables contained in fn into a Dataset, which allows you to conduct operations across all variables in the file. ds.variable extracts the variable named 'variable' specifically, into a DataArray. Data is loaded ‘lazily,’ meaning only variable information (not content) is loaded until calculations are done on them. To force loading, run ds.load().
var = ncread(fn,'variable');
ncfile <- nc_open(fn)
var <- ncvar_get(ncfile,'variable')
ncf = nc.Dataset(fn)
var = ncf.variables['variable'][:]
ncf.variables[variable] returns a float object that keeps the attributes from the NetCDF file
Loading a subset of a NetCDF file#
NetCDF files can be partially loaded, which is useful if you only need a geographic or temporal subset of a variable, or the file you are trying to open is particularly large compared to your system’s memory. Unless you are using xarray (which allows you to refer to dimensions by name), make sure you confirm the order of dimensions first by reading the NetCDF header, to avoid subsetting the wrong dimension.
The following example assumes fn is a file containing a 3-dimensional (lon,lat,time) variable called “variable”, and extracts a 5 x 5 pixel time series for 365 time steps:
Data is loaded lazily and only fully loaded when calculations are done, so you can slice (subset) data without loading it into memory. Slicing can be done by time, variable, etc.
ds = xr.open_dataset(fn))
ds = ds.loc[0:5,0:5,0:365]

# or, if you know the dimension variables (e.g., lat, lon, time):
ds = ds.isel(lat=slice(0,5),lon=slice(0,5),time=slice(0,5))

# or, if you know the values of the dimensions you want - this command
# would roughly subset your dataset to the continental United States
# and the years 1979 to 2010.
# (note the use of "sel" vs. "isel" above)
ds = ds.sel(lat=slice(22,53),lon=slice(-125,-65),time=slice('1979-01-01','2010-12-31'))
% in the format ncread(filename,variable name,start idx,count)
var = ncread(fn,'variable',[1 1 1],[5 5 365]);
ncfile <- nc_open(fn)
vardata <- ncvar_get(ncfile, variable, start=c(1,1,1), count=c(5,5,365))
These files also include variables that give values for indices along each dimension (lon, lat / location and time), which can be extracted like any other variable using the functions listed above. In some cases, these may be listed as lat, latitude, Latitude, Lat, latitude_1, nav_lat, and any number of other names. Therefore, make sure to first double-check the name of those dimensions in the NetCDF header.
Note
Longitude can be either of the form -180:180 or 0:360. In the latter form, 359 is 1\(^\circ\)W and so forth.
The time variable can also be listed in a few different formats. An integer representation of “days since [some date, often 1850-01-01]” is common, as is an integer representation of the form [YYYYMMDD], among others. The key is to always check the description of the variable in the header, and adjust your methods accordingly until it’s in a format you want it in. If you’re using Python, the xarray package has the ability to interpret some of these time representations for you and translates them into the datetime64 class, which makes some kinds of manipulation, like averaging over months, easier.
Now that you have loaded your weather and climate data, a good practice is to double-check that it is downloaded and processed correctly. Common red flags include suspiciously many NA / NaN values, suspiciously high or low values, or variables that unexpectedly don’t line up with geographic features. Plotting your data, the basics of which we’ll cover next, can be a good first-order check.
Basic visualization of climate and weather data#
To diagnose your data or to illustrate the weather and climate data used in your model, you will likely want to create plots and maps. The following is a very high-level overview; more detailed guides include:
- 📚 An Introduction to Earth and Environmental Data Science
A great guide to working with
xarrayin general, but also to plotting geographic data withxarrayandcartopy, especially the section on “Maps in Scientific Python”- 📚 Visualizing and Processing Climate Data Within MATLAB
A guide to plotting climate data using MATLAB, created by the institute that publishes ERA5
2-dimensional plotting#
Assuming that your data is loaded and named as it is in the section above, the following example shows how to plot the time series of a single-pixel of your variable “variable”, or an average across all pixels.
# This will plot a time series of the first lat/lon pixel
ds.variable.isel(lon=0,lat=0).plot()

# This will plot a time series of the pixel closest to 23N, 125W
ds.variable.sel(lon=-125,lon=23,method='nearest').plot()

# This will plot the average time series over all lat/lon points
# Note that, if your data is on a normal rectangular grid (even
# lat/lon spacings), you will need to weight your data to account
# for the changing size of the pixels with latitude
weights = np.cos(np.deg2rad(ds.lat))
ds.variable.weighted(weights).mean(('lat','lon')).plot()
As before, we’re assuming the variable variable is in the form lon,lat,time.
% This will plot a time series of the first lat/lon pixel
plot(squeeze(variable(1,1,:)))

% This will plot the average time series over all lat/lon points
% Note that, if your data is on a normal rectangular grid (even
% lat/lon spacings), you will need to weight your data to account
% for the changing size of the pixels with latitude
weights = cos(deg2rad(lat))
% Now, first take the mean over longitude, then the weighted mean
% over latitude values, and plot the result, squeezing to get rid
% of size-1 dimensions
plot(squeeze((weights'*squeeze(mean(variable,1)))/sum(weights)))
Maps#
Weather and climate data is generally geographic in nature; you’re therefore likely to want or need to create maps of your variables. Maps can also offer an easy first-order check to see if your data subset correctly. Assuming that your data is loaded and named as it is in the section above, the following example shows how to plot a map of a single timestep of your variable “variable” or an average across all timesteps.
Note that which map projection you use will influence how you read the map. In the code examples below, we will use an equal-area projection, in which every grid cell in the gridded data is shown with its accurate relative area, to avoid visually overemphasizing data in regions with smaller geographic extent. To see which other projections are available, see the relevant parts of the documentations (here for cartopy/python, and here for Matlab)
## Example without geographic information:
# To plot a heatmap of your 3-dimensional variable
# at the first timestep of the data
ds.variable.isel(time=0).plot()
# To plot a heatmap of your variable, averaged across
# all timesteps
ds.variable.mean('time').plot()


## Example with geographic information:
import cartopy.crs as ccrs
from matplotlib import pyplot as plt
# Create axis, setting the projection of the final map as the
# Eckert IV equal-area projection
ax = plt.axes(projection=ccrs.EckertIV()
# Plot data; specifying that the dimensions of the data should be
# interpreted as lat/lon values
ds.variable.isel(time=0).plot(transform=ccrs.PlateCarree()
# Add coastlines
ax.coastlines()
# (to plot the time mean, for example, use instead
# ds.variable.mean('time').plot(transform=ccrs.PlateCarree())
As before, we’re assuming the variable variable is in the form lon,lat,time.
% To plot a heatmap of your 3-dimensional variable
% at the first timestep of the data
pcolor(squeeze(variable(:,:,1)).'); shading flat
%  To plot a heatmap of your variable, averaged across
% all timesteps
pcolor(squeeze(mean(variable,3)).'); shading flat

% Alternatively, with geographic information:
axesm('eckert4') % Set desired projection in the function call; i.e. 'eckert4'
pcolorm(lat,lon,squeeze(variable(:,:,1)).'); shading flat
% coast.mat is included with Matlab installations; this will add coastlines.
coasts=matfile('coast.mat')
geoshow(coasts.lat,coasts.long)
Moving forward#
Now that you know how to read NetCDF files and conduct basic operations and plotting with them, you can start downloading and using the weather and climate data you need for your projects. To take the first steps on this road, we’ll cover the basics of gridded data in the next section.